


![]()
![]()
Complete Toledo Bend Lake Level History
Graphs: 30 Years 1969 – 1999
Graphs for 30 years of the lake’s 45 year history showing the lowest level each year.
Table: 48 Years 1968 – 2015
Table of monthly lake levels for the last 45 years In response to a number of questions, here is the information that Toledo-Bend.Com has come up with on the historic levels of the lake from the period of 1969 through 2012. Some of this information seems to be available only in graph form; from 1986 it is available as hard data, though – which we have painstakingly parsed out for you. You didn’t really want to read over 9,000 daily lake level readings, did you? So, here are about 300 monthly levels. JANUARY, 2012: We got the daily lake levels from 1968 – 1986 and now have a complete history of the monthly average (1968-1999) or mean (1999-2011) levels. A BIG THANK YOU To Mr. David Barnhill of Many, LA! He found records of the lake level, day-by-day from its inception in 1968 – 1986 and has furnished those to Toledo-Bend.Com – which filled in the big blank spot in lake leves from 1968 – October 1986 and now gives a complete history of the levels of Toledo Bend throughout its existance! -1/14/2012
Lowest Recorded Lake Levels: 161.25 – October 16, 2006 159.42 – November 22, 2011
Highest Lake Levels (1968-1996) – 173.73 Days over 173 MSL: Dec 3-10, 1968 Max 173.38 Mar 18-27, 1969 Max 173.42 May 3, 1973 Max 173.11 Jan 23-28, 1975 Max 173.4 May 22, 1983 Max 173.08 May 18-20, 1989 Max 173.73 June 29-July 5, 1989 Max 173.44 May 17-18 + June 1-4, 1990 Max 173.18 Apr 25-28, 995 Max 173.1 Mar 18, 2015 Max 173.0 Mar 22-24, 2015 Max 173.2
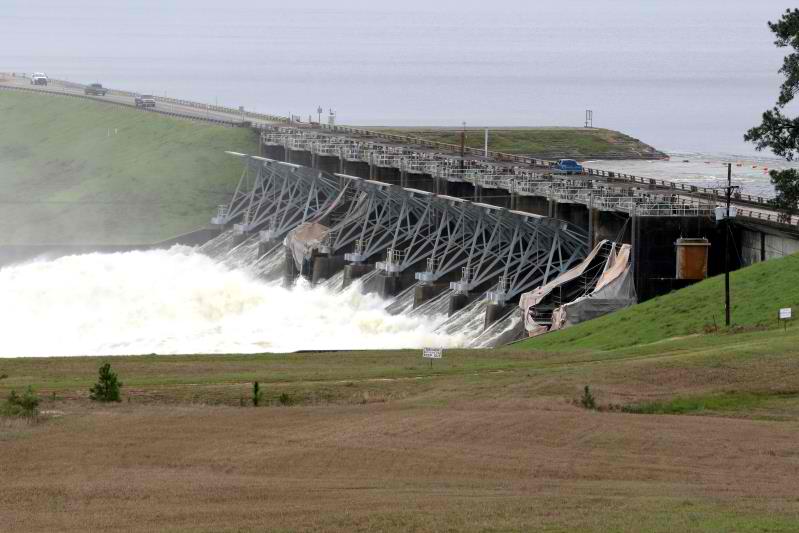
Toledo Bend Reservoir at HISTORIC Level!
Thursday 3/10/2016 Toledo Bend Lake hit a historic high level at the dam of 174.36 MSL at about 6:00 AM. The following pictures were taken at 1:00 PM March 10, 2016 when the SRA Louisiana had brought the lake rise under control and it had actually gone down about an inch to 174.25 MSL. There were 9 gates open 22 feet (the other 2 gates are undergoing maintenance) and Generator was running. Total release was 207,644 cubic feet per second (CFS) of water – that’s just over 1.5 million gallons per second! It is enough to fill 7 Olympic swimming pools every 3 seconds. The water flowing through the gates was sill a few inches below the gate openings, though, because the water is constricted as to comes into the passage ways for the gates – actually flowing downhill to the gates! The most the gates had ever been opened before was 11′ with a flow of 99,000 CFS.
| All images are © Copyright 2016 by Toledo-Bend.Com. Feel free to link to this page – HOWEVER, these pictures MAY NOT BE COPIED and sent or posted elsewhere. ~Click any image for an enlargement~ | ||
 |
 |
 |
| Toledo Bend Lake Spillway with Gates Open 22′ | ||
 |
 |
 |
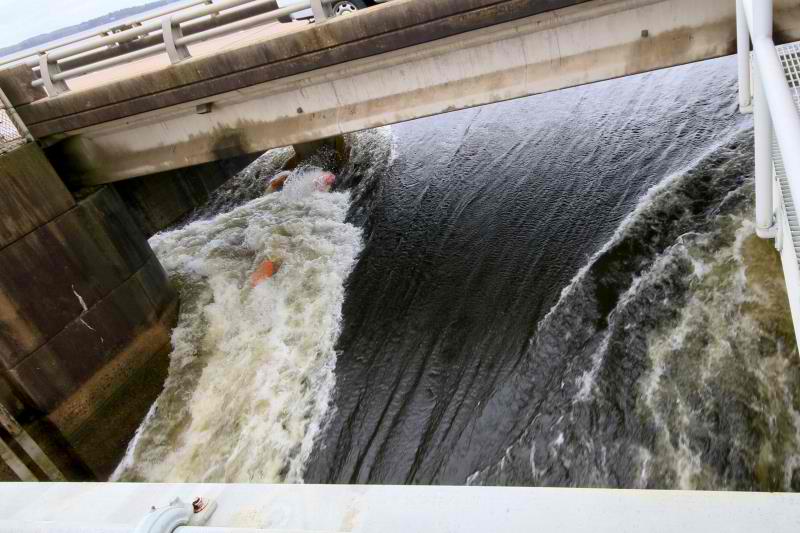
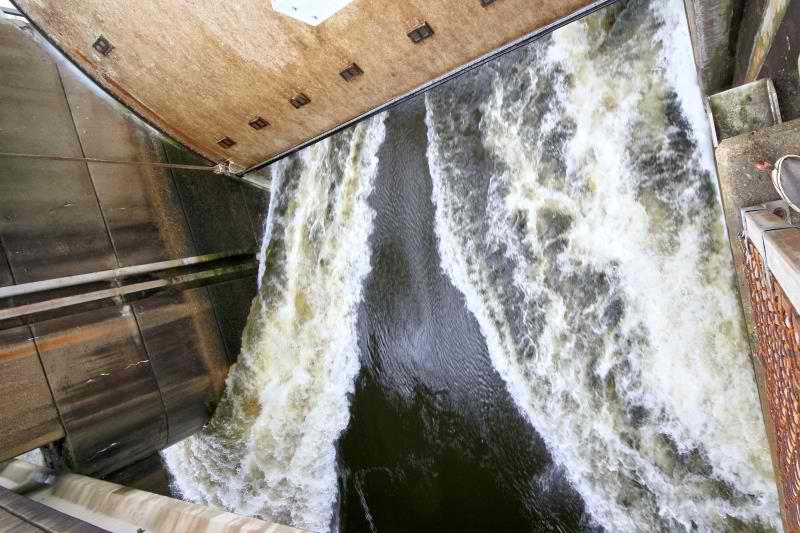
| Water coming into gate | Water going through under gate | |
 |
 |
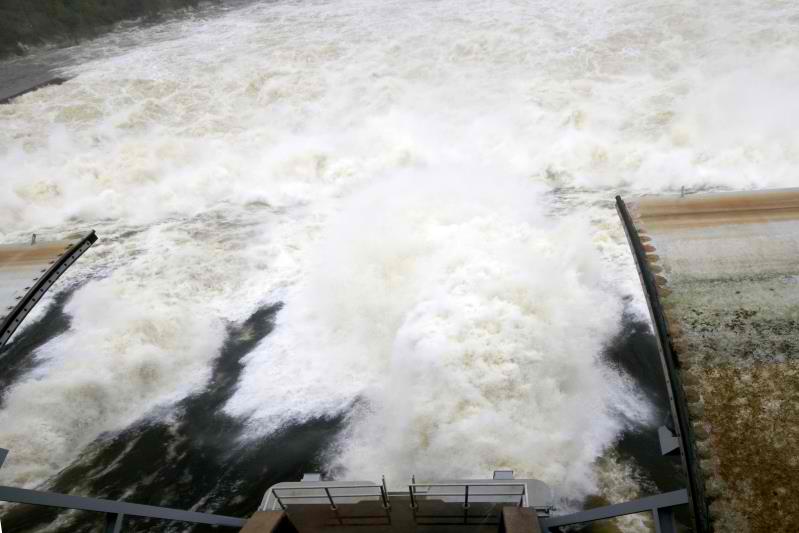 |
| Water after passing through gates going into Sabine River | ||
| All images are © Copyright 2016 by Toledo-Bend.Com. Feel free to link to this page – HOWEVER, these pictures MAY NOT BE COPIED and sent or posted elsewhere. ~Click any image for an enlargement~ | ||
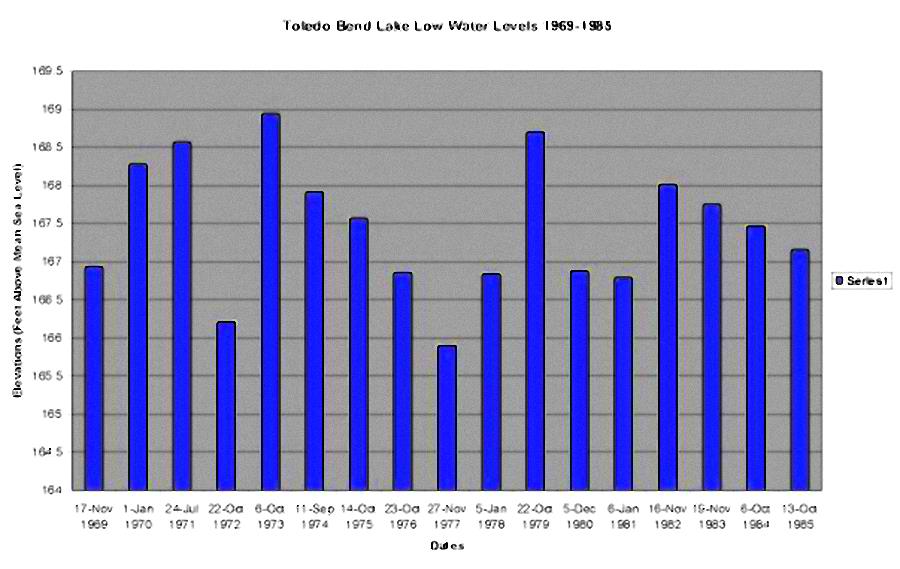
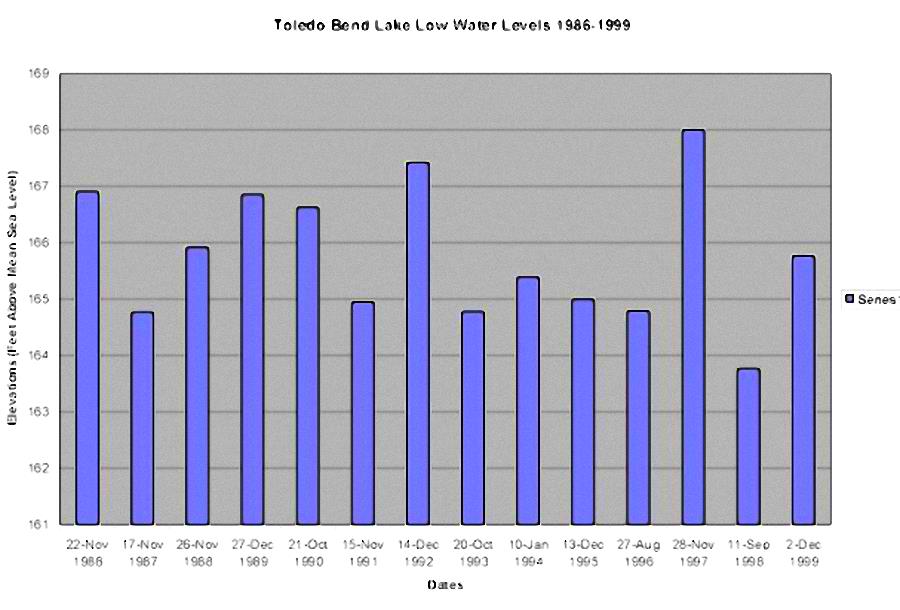
Graphs of lowest lake levels for the years 1969 – 1999Click any image for enlargement |
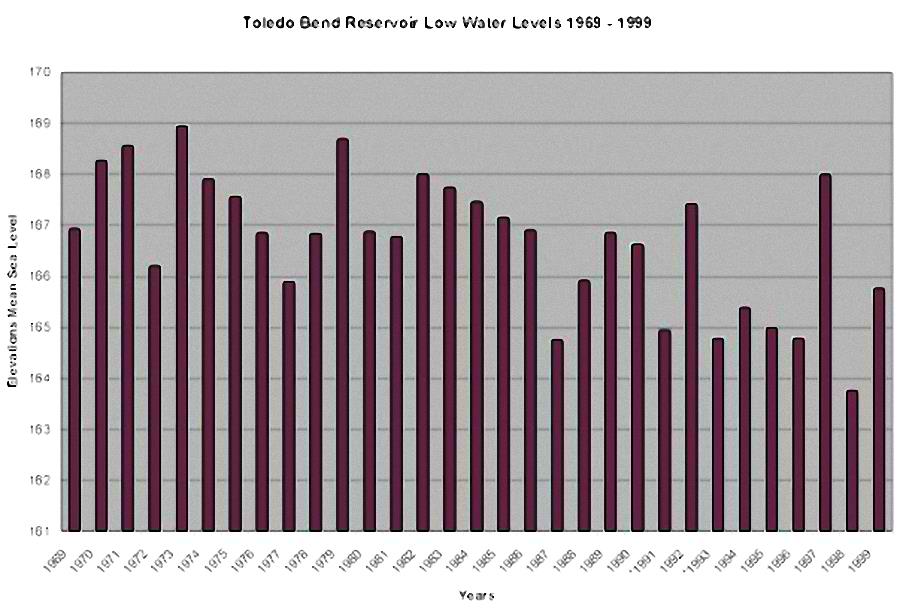 |
| Lowest Lake Levels ’69 – ’85 | (above) Lowest Lake Levels ’69 – ’99 (below) Lowest Lake Levels ’86 – ’99 |
 |
 |
Toledo Bend Reservoir – Lake Level MSL 1968 – 2015 |
||||||||||||
Monthly average/mean level in feet above MSL Average for 1968 – Oct, 1999 – Mean for Oct, 1999 – Mar, 2011 – mostly – for some months data was missing and had to be gathered and it was averaged. In spot checking – Average from Mar, 2011 – present, we found the differences between average and mean to be less than 0.02 ft. For 2012 the levels are mean for each given month.NOTE: Lake is low in 1968 because that is when it is filling up! Notice how quickly it rose 24 feet from January through May! 1968 is not included in overall average figures at bottom for this reason |
||||||||||||
| Jan | Feb | Mar | Apr | May | Jun | Jul | Aug | Sep | Oct | Nov | Dec | |
| 1968 | 147.86 | 152.40 | 155.96 | 165.54 | 171.21 | 172.37 | 172.42 | 172.20 | 172.25 | 172.06 | 171.99 | 172.78 |
| 1969 | 171.13 | 172.00 | 172.76 | 171.98 | 172.20 | 171.49 | 170.56 | 169.53 | 168.21 | 167.35 | 167.25 | 167.85 |
| 1970 | 169.15 | 169.74 | 171.22 | 170.99 | 171.35 | 171.31 | 171.04 | 170.05 | 169.45 | 169.01 | 170.02 | 170.17 |
| 1971 | 169.58 | 169.54 | 169.69 | 169.67 | 169.92 | 169.56 | 168.96 | 169.15 | 168.89 | 168.68 | 169.02 | 169.94 |
| 1972 | 170.64 | 170.04 | 170.60 | 171.38 | 171.38 | 170.30 | 170.20 | 169.24 | 167.36 | 166.49 | 167.95 | 169.95 |
| 1973 | 171.20 | 171.49 | 172.25 | 172.40 | 172.51 | 172.28 | 171.91 | 171.02 | 170.06 | 169.89 | 171.62 | 172.40 |
| 1974 | 172.65 | 172.14 | 171.50 | 171.91 | 171.80 | 171.48 | 170.88 | 168.99 | 168.06 | 168.61 | 171.19 | 172.42 |
| 1975 | 171.98 | 172.23 | 171.39 | 170.24 | 172.19 | 172.24 | 171.89 | 170.60 | 168.66 | 167.78 | 168.27 | 168.45 |
| 1976 | 169.22 | 169.76 | 170.29 | 170.34 | 171.75 | 172.05 | 172.11 | 170.05 | 168.10 | 167.09 | 167.08 | 167.84 |
| 1977 | 168.54 | 169.55 | 170.88 | 171.58 | 171.85 | 170.89 | 169.84 | 168.55 | 167.36 | 166.33 | 166.19 | 166.62 |
| 1978 | 167.59 | 169.48 | 169.80 | 170.45 | 170.85 | 170.56 | 169.32 | 168.35 | 168.67 | 168.71 | 168.53 | 169.22 |
| 1979 | 171.35 | 172.00 | 171.68 | 172.16 | 172.09 | 172.12 | 171.05 | 170.47 | 169.35 | 168.88 | 169.25 | 169.15 |
| 1980 | 169.16 | 171.01 | 170.23 | 171.95 | 172.16 | 171.63 | 170.54 | 169.22 | 168.22 | 167.21 | 167.13 | 167.02 |
| Jan | Feb | Mar | Apr | May | Jun | Jul | Aug | Sep | Oct | Nov | Dec | |
| 1981 | 166.90 | 167.06 | 167.52 | 167.57 | 168.07 | 170.66 | 171.72 | 169.63 | 168.92 | 168.76 | 169.18 | 169.43 |
| 1982 | 169.45 | 169.88 | 169.80 | 171.00 | 171.34 | 170.92 | 170.93 | 169.64 | 168.59 | 168.30 | 168.27 | 170.70 |
| 1983 | 170.78 | 171.46 | 171.21 | 170.33 | 171.46 | 171.79 | 170.50 | 169.37 | 168.81 | 168.41 | 168.16 | 169.79 |
| 1984 | 169.26 | 170.11 | 171.08 | 170.61 | 171.21 | 171.03 | 169.53 | 168.45 | 167.92 | 168.17 | 169.11 | 169.12 |
| 1985 | 168.97 | 169.75 | 170.73 | 170.54 | 171.90 | 171.51 | 170.18 | 168.75 | 167.81 | 167.52 | 169.41 | 171.45 |
| 1986 | 170.51 | 169.25 | 169.24 | 169.76 | 171.16 | 172.50 | 171.85 | 170.13 | 169.10 | 168.498 | 167.866 | 170.195 |
| 1987 | 169.525 | 169.524 | 171.868 | 170.037 | 169.307 | 168.989 | 168.403 | 166.545 | 165.788 | 165.193 | 165.761 | 167.911 |
| 1988 | 170.047 | 169.107 | 169.829 | 170.373 | 169.89 | 168.875 | 168.103 | 167.685 | 167.044 | 166.442 | 166.183 | 167.076 |
| 1989 | 168.999 | 169.523 | 169.726 | 171.546 | 171.873 | 172.56 | 172.292 | 171.148 | 169.481 | 168.101 | 167.798 | 167.358 |
| 1990 | 169.109 | 172.25 | 170.572 | 170.973 | 172.271 | 172.259 | 170.682 | 168.759 | 167.482 | 166.935 | 167.292 | 168.439 |
| 1991 | 171.581 | 171.836 | 171.504 | 171.505 | 172.491 | 171.506 | 171.174 | 170.474 | 169.103 | 166.292 | 165.287 | 166.304 |
| 1992 | 169.193 | 171.876 | 172.593 | 171.274 | 170.981 | 171.517 | 171.384 | 169.926 | 168.574 | 167.645 | 167.664 | 168.308 |
| 1993 | 170.766 | 170.137 | 171.214 | 172.159 | 170.79 | 170.678 | 171.076 | 168.874 | 166.164 | 165.008 | 165.377 | 165.499 |
| 1994 | 165.86 | 168.635 | 170.827 | 170.299 | 171.662 | 171.629 | 170.848 | 170.928 | 169.128 | 169.4 | 169.098 | 168.831 |
| 1995 | 171.562 | 171.926 | 172 | 171.56 | 172.042 | 171.571 | 170.577 | 168.808 | 166.858 | 165.783 | 165.478 | 165.528 |
| Jan | Feb | Mar | Apr | May | Jun | Jul | Aug | Sep | Oct | Nov | Dec | |
| 1996 | 166.044 | 165.872 | 165.626 | 165.663 | 165.817 | 165.609 | 165.281 | 165.105 | 165.227 | 165.639 | 165.803 | 167.178 |
| 1997 | 169.031 | 170.966 | 172.831 | 172.593 | 172.308 | 172.061 | 171.654 | 170.893 | 169.7 | 169.125 | 168.41 | 169.045 |
| 1998 | 171.876 | 172.535 | 172.163 | 170.737 | 170.24 | 169.191 | 167.41 | 165.274 | 164.864 | 165.85 | 167.958 | 169.746 |
| 1999 | 171.849 | 171.738 | 170.197 | 170.557 | 170.271 | 170.793 | 171.006 | 169.16 | 167.425 | 166.776 | 166.365 | 166.246 |
| 2000 | 166.111 | 165.902 | 166.309 | 169.120 | 170.894 | 171.389 | 171.654 | 169.826 | 167.960 | 166.945 | 167.621 | 168.779 |
| 2001 | 170.543 | 171.951 | 172.861 | 171.861 | 170.920 | 171.317 | 170.812 | 168.964 | 166.697 | 163.544 | 163.707 | 167.937 |
| 2002 | 170.499 | 170.173 | 170.012 | 171.967 | 171.836 | 171.787 | 170.775 | 168.836 | 166.840 | 166.338 | 168.246 | 168.859 |
| 2003 | 169.934 | 169.972 | 172.085 | 171.039 | 170.827 | 170.669 | 170.335 | 168.771 | 167.264 | 166.325 | 166.477 | 167.294 |
| 2004 | 167.941 | 171.605 | 171.619 | 170.288 | 172.144 | 172.097 | 171.957 | 170.278 | 168.596 | 168.467 | 169.172 | 170.029 |
| 2005 | 169.051 | 169.972 | 169.908 | 170.670 | 170.088 | 168.954 | 167.476 | 165.512 | 163.611 | 163.572 | 163.097 | 162.905 |
| 2006 | 162.974 | 164.776 | 166.639 | 168.159 | 168.420 | 167.210 | 165.626 | 163.635 | 162.088 | 162.923 | 165.144 | 165.444 |
| 2007 | 170.294 | 170.360 | 169.964 | 170.845 | 171.107 | 170.933 | 172.019 | 171.481 | 169.603 | 167.914 | 167.673 | 167.946 |
| 2008 | 168.425 | 169.496 | 170.695 | 172.320 | 171.886 | 171.476 | 170.350 | 168.533 | 168.118 | 167.745 | 167.863 | 168.298 |
| 2009 | 168.477 | 168.751 | 169.936 | 171.473 | 171.936 | 171.286 | 169.822 | 168.985 | 168.318 | 169.805 | 172.357 | 170.718 |
| 2010 | 169.868 | 170.180 | 171.857 | 170.537 | 170.218 | 169.177 | 168.274 | 167.701 | 166.148 | 164.414 | 164.062 | 163.818 |
| Jan | Feb | Mar | Apr | May | Jun | Jul | Aug | Sep | Oct | Nov | Dec | |
| 2011 | 163.877 | 164.602 | 164.574 | 164.371 | 163.853 | 163.318 | 162.642 | 161.793 | 160.954 | 160.188 | 159.781 | 160.324 |
| 2012 | 162.28 | 164.92 | 168.86 | 170.50 | 170.29 | 169.35 | 169.32 | 168.97 | 168.52 | 168.42 | 167.77 | 167.55 |
| 2013 | 169.04 | 169.03 | 169.17 | 170.06 | 170.37 | 170.35 | 169.26 | 168.07 | 167.44 | 167.57 | 168.25 | 168.36 |
| 2014 | 168.77 | 169.17 | 169.73 | 170.54 | 171.04 | 171.14 | 171.29 | 171.22 | 170.37 | 169.04 | 168.15 | 168.31 |
| 2015 | 169.54 | 169.18 | 171.78 | 172.33 | 172.33 | 172.53 | 171.84 | 170.36 | 168.65 | 167.77 | 169.83 | 172.04 |
| Average Level for 48 years 1969 – 2015 | ||||||||||||
| AVG | 169.176 | 169.843 | 170.401 | 170.642 | 170.920 | 170.734 | 170.134 | 168.885 | 167.690 | 167.122 | 167.512 | 168.249 |
| Jan | Feb | Mar | Apr | May | Jun | Jul | Aug | Sep | Oct | Nov | Dec | |
| 2016 | ||||||||||||
SOURCE: USGS (primarily) – As these figures were obtained from different databases, there is some difference; the figures for 1986 – September, 1999 are monthly AVERAGES calculated by the webmaster from daily figures (yes, about 5,000 days worth!!!); the figures subsequent to September, 1999 are the mean levels as obtained from USGS (well, most are; a few we had to research and calculate since they weren’t provided). In spot checking, we found the differences between average and mean to be less than 0.02 ft.PLEASE NOTE: while these figures are available from public sources, the information presented here is Copyright © 2011 by Frank Dutton / Toledo-Bend.Com as an original compilation derived from other data – all rights reserved. |
||||||||||||